Three years ago I ran a MeasureCamp discussion session entitled “Track everything, measure what matters“; a concept that was the norm in 2016. Back then, the challenge with this concept, as it still is today, is the issue of “time”…
 Strategy, Insights and UX
Advocate for UX and customer-centric "insight" driven design #UX #Analytics #Insights #CRO #SitecoreMVP
Strategy, Insights and UX
Advocate for UX and customer-centric "insight" driven design #UX #Analytics #Insights #CRO #SitecoreMVP
Blog Archives
Leveraging Google Analytics to measure effectively
Tagged with: Google Analytics, measurecamp, measurement, Strategy
Posted in General Advice, Insights, Measurement Model, Understanding Google Analytics
Posted in General Advice, Insights, Measurement Model, Understanding Google Analytics
Measuring the impact of Beta
In digital transformation more often than not we iterate a service; however at certain times we have to launch something new. Normally this is when software changes (new CMS or major changes in coding practices) or when the service hasn’t…
Tagged with: goal completion, Google Analytics, measurement, metrics that matter, pageviews, segmentation, sessions, time online
Posted in Goals, Measurement Model, Understanding Google Analytics
Posted in Goals, Measurement Model, Understanding Google Analytics
Creating heat map report for scroll depth using google sheets google analytics api

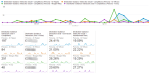
Prompted by a tweet Heat map visualization for scroll depth tracking sorted by top pages for my blog #googleAnalyticsR #measure #rstats cc @bosilytics pic.twitter.com/zpPpgB7Rua — Ryan Praskievicz (@ryanpraski) February 16, 2017 I set myself a challenge of utilsing Google Sheets…
Google analytics add-on for google sheets: Top tips and common problems

Over the last few weeks I have been getting accustom to producing reports in google sheets using the google analytics add-on. Why google sheets for producing google analytics reports? Previously, to share google analytics reports you had a few…
Tagged with: API, Google Analytics, Google Sheets
Posted in Google Sheets, Understanding Google Analytics
Posted in Google Sheets, Understanding Google Analytics
Organising your Google Analytics Account(s) – Give it an spring clean

So a new job and a new Google Analytics Account(s) to unravel. At first was just going to review my post from last year – Naming convention for Account, Property and View – Google Analytics (which i have) but it…
Tagged with: accounts, events, filters, goals, Google Analytics, property's, Segment, user management, views
Posted in Measurement Model, Understanding Google Analytics
Posted in Measurement Model, Understanding Google Analytics
Know your user – 5 advanced segments to use when defining “real users” – Google Analytics

Following on from my post on aggregated metrics (pageviews, sessions, users) I thought it would be good to share some segment ideas that can define your users into “real users”. Using this metric (rather than the aggregated version) or as…
Tagged with: advanced, best practice, Google Analytics, insights, Segment, segmentation
Posted in Insights, Understanding Google Analytics
Posted in Insights, Understanding Google Analytics
Humanise your data: 5 things you can do to get Google Analytics reporting on real “user” insights
Often when we talk quantitative data, we talk metrics and dimensions: sums, averages, aggregates, time, day etc. Data is often soulless and very rarely contains context especially a human context. On the flip side, qualitative data or persona information is…
Tagged with: data, Google Analytics, humanise, insights, intergation, qualitative, quantitative, Quantitative and qualitative data, quantitative data, real data, user
Posted in Insights, Understanding Google Analytics
Posted in Insights, Understanding Google Analytics
Using Personas in Google Analytics to drive “real” insights
No doubt a lot of you use or have heard about personas. Creating personas comes from analysing and understanding user behaviour from a range of sources including quant data. At NICE we have begun the journey of creating personas and naturally I started…
Tagged with: datalayer, Google Analytics, Google Tag Manager, GTM, insights, persona, personas, user role
Posted in General Advice, Insights, Understanding Google Analytics, User Research
Posted in General Advice, Insights, Understanding Google Analytics, User Research
Unexpected results when using Dashboard Widget and “Sessions with event”
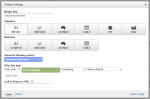
This short post documents some finding from my google+ post. I wanted to create a simple dashboard for key stakeholders to see not only overall sessions but sessions when a certain event (a micro conversion) had occurred. The site in…
Tagged with: dashboard, filter, Google Analytics, segmentation, sessions, sessions with event, widget
Posted in Understanding Google Analytics
Posted in Understanding Google Analytics
Customize Dashboards in Google Analytics – Tips plus requested features
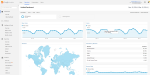
Presenting data, especially key metrics is part of the day to day role of Google Analytics users. We often have to produce collections of data, specific to parts of a website or more importantly data that relates to the objectives…
Tagged with: customize, customize dashboard, dashboard, dashboards, design, Google Analytics, layout options, widget
Posted in Design, Insights, Understanding Google Analytics
Posted in Design, Insights, Understanding Google Analytics
