
Over the last few weeks I have been getting accustom to producing reports in google sheets using the google analytics add-on.
Why google sheets for producing google analytics reports?
Previously, to share google analytics reports you had a few options. Firstly just let people loose on Google Analytics, secondly get Google Analytics to email some custom reports or thirdly actually build reports/ dashboards using the API direct into a website. Whilst the first two options were easy to set up; they basically opened up the door to the world of mis-understood data in the wrong hands. The third option cures this problem but needed some technical developer expertise on hand.
But now we have a forth option: Google sheets and the google analytics add-on.
This is the ideal solution. You have access to the API but in a friendly usable tool where you can present the right data to the right people (with little developer assistance).
Tops tips (and resources)
If you are new to Google Sheets and the Google analytics add-on, there is no better place than Google developer site and the videos from Philip Walton. For the remainder of this post I will focus on tips and tricks I have learnt along the way.
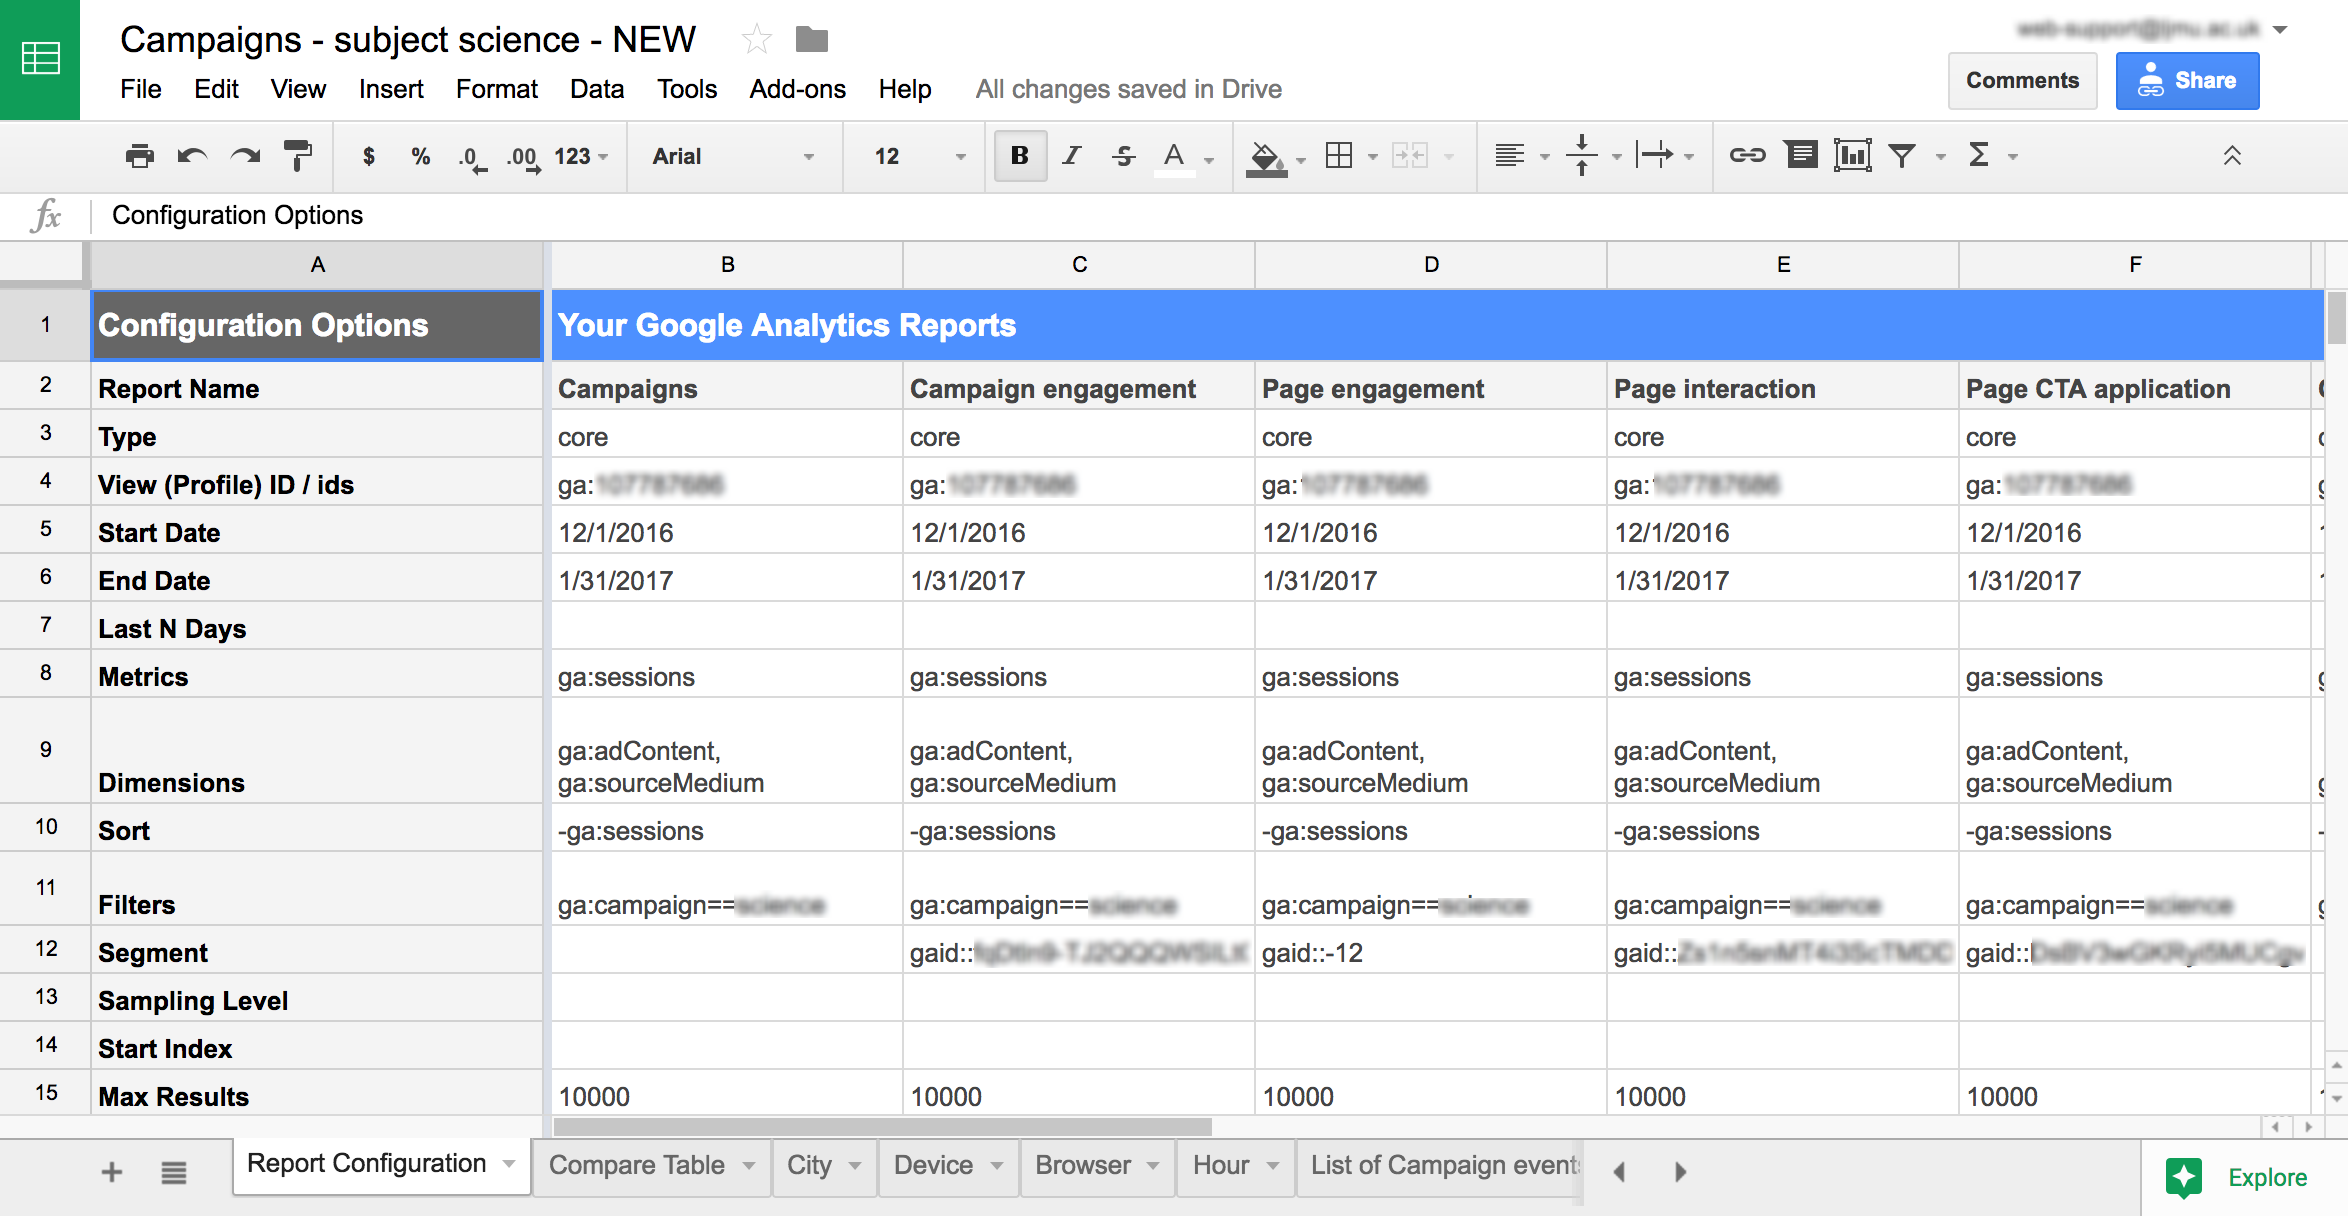
Google sheets report configuration
Dates (Start Date, End Date and Last N Days)
One of the joys of using the Google sheets is that your reports can present dates without you having to re-configure reports using clever date formulas. Its very easy to produce reports with fixed start and end dates, but also easy to create fixed time periods such as “this month”, “this week”, “last month” or even “last year”. Ashraf Chohan at Government Digital Services has written a great post on creating relative date formulas in Google Sheets.
These same date formulas can also be used for labels or legends. This way your data and labels/ legends update as your data does.
As an example I have created a rolling 12 month report. So in the Report Configuration I have set up 12 columns starting with the last full month [Start date: =EOMONTH(TODAY(),–2)+1 and End date: =EOMONTH(TODAY(),–1)] and so on for the reminding 11 months. I have then created an additional sheet to build a report/ chart combining all the data.
But on that report I don’t want 1/11/16 as a label, I want November. So this just needs a tweak. Using either the start or the end date we add the tweaked formula: =TEXT(EOMONTH(TODAY(),–2)+1,“MMM”) or =TEXT(EOMONTH(TODAY(),–1),“MMM”)
Metrics and Dimensions
They say Metrics are from Mars and Dimensions are from Venus. Its important to remember only certain metrics can go with certain dimensions. This is down to the fact some are hit-level and some are session-level. If you don’t know the available list of Metrics and Dimensions (or in fact know the API names) your first port of call is the Dimensions and Metrics explorer. The really good part to the explorer is that it will guide you when matching hit dimensions to hit metrics and session dimensions to session metrics. Once you pick a variable it will grey out those that you cant match.
NB: If you want multiple Dimensions or metrics, separate with a comma and whitespace.
Sort
Nothing magical here, preceding the Dimension/ Metric with – gets the order Z-A or if numerical highest to lowest which is quite handy when using the data for pie charts where you want an order to pie’s.
Filters and Segments
Now this is the most tricky part and where you might need a hand, especially someone who knows regular expression syntax. Luna Metrics have covered this very well with their Google Sheets/ Google Analytics guide Pt2.
As I have several custom segments, I mainly take advantage of the Query Explorer to uncover my Segment names. Im an advocate for segmenting data as this is where you find your insights, so most my reports in Google Sheets include a segment name.
NB, unlike Metrics and Dimensions, to add multiple filters; for (and) use a semicolon with no space, for (or) use comma with no space.
Sampling level
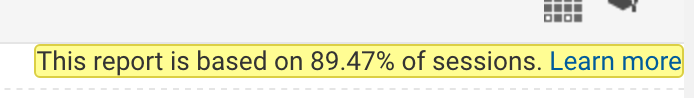
As per Google Analytics sampling kicks in when dealing with a lot of data or refined data. Same applies to the Google Analytics add-on. You can leave it blank or you can enter “DEFAULT,” “FASTER,” or “HIGHER_PRECISION”. My experience is that google sheets automatically goes for the higher precision. The way to tell is to look at the reports for the line “Percentage of visits this report is based on”. Examples below show the matching figures in Google Sheets and Google Analytics. So if ever your data isn’t matching first port of call is to look at your sampling in both solutions. They probably don’t match.
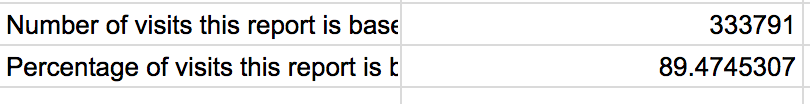
Google sheets screen shot of sampling
Google sheets screen shot of sampling
Max results
At first I thought why cap this, I want to analyse all the data. This is true for most cases, unless the data you need is purely for charts. Here you might want top 5 sources or top 10 browsers and if this is the case you need to enter a small value. If not keep this figure high 10,000 or similar.
Common problems
Data match to GA
I have had this often. As mentioned above, first port of call is to check the sampling level in Google Analytics matches that in Google Sheets. Next up is the time of the reports. If your report date ranges are anything other than today then you are fine. But if your report includes today; it will be different than Google Analytics as that has a delay in compiling data (only minimal). Similarly if you schedule reports it will be different than Google Analytics as the schedule is slightly out of sync as its over an hour.

Schedule reports screen grab
Access to interact
Google sheets allows you to share very easily. You can either share a link or ideally share with a known google account. Some of my sheets allow for filtering or a drop down select and I have found this only works if you share when using a google account not the link (even with edit selected).
Referencing other tabs in google sheets
This is a simple one, but if your other sheets include a space then when referencing it you use commas. If its one word you don’t. For example:
=VLOOKUP(A2,newpage!C$1:E$4222,2,false)
=VLOOKUP(A2,’new page’!C$1:E$4222,2,false)
Combining segments
A lot of the analysing I do in Google Analytics involves segments, especially data with one segment against another. To do this in Google sheets, you have to compile several reports each with a different segment. The challenge is matching this back up. Using a new sheet to bring the data together and several array and/ or vlookup rules I am able to show segments along side each other.
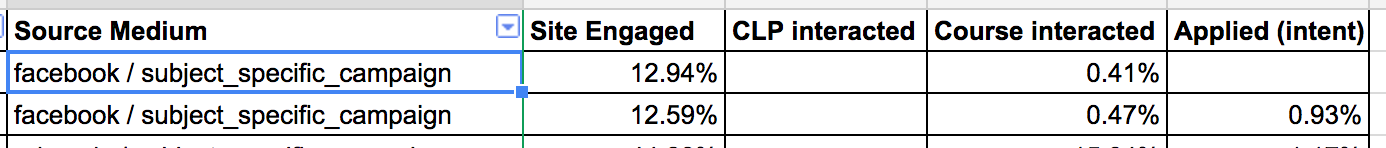
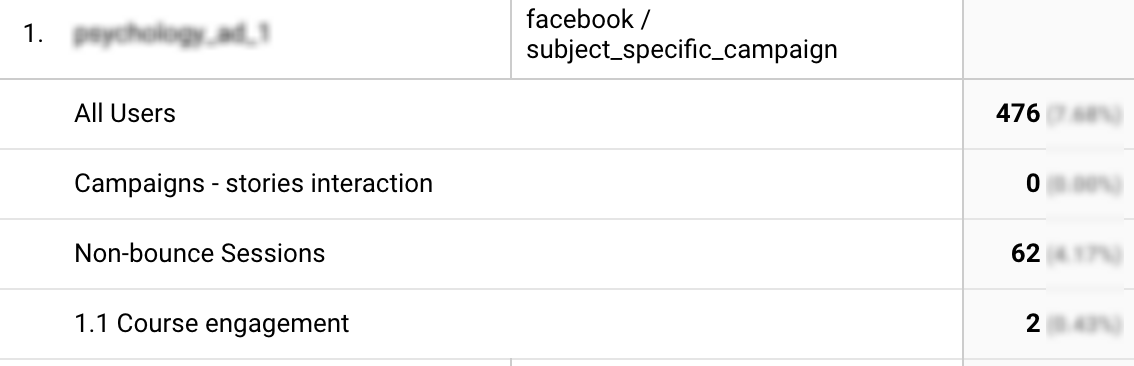
Source medium segments in google sheets
Source medium segments in google analytics
Very interested to hear other peoples experiences with the Google Sheets Google Analytics API. To date, my feedback has been that data shared via Google Sheets is very well received.


Leave a comment