
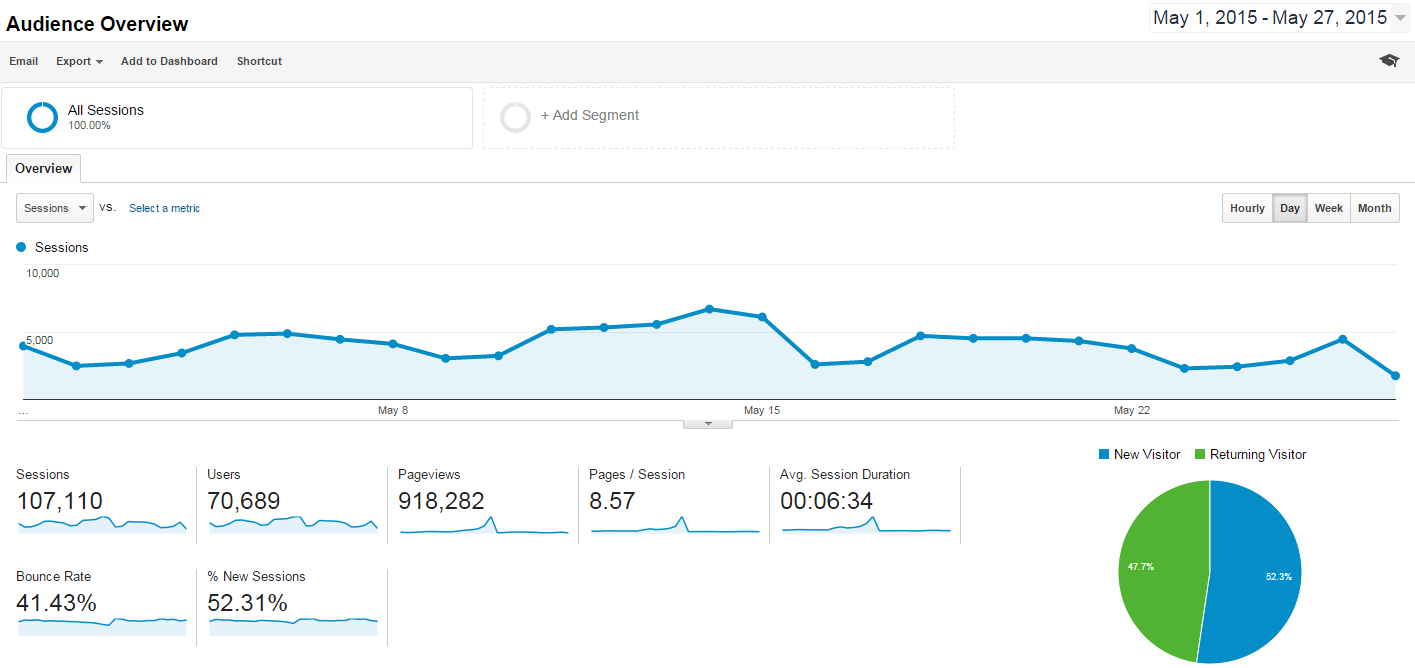
Google Analytics Audience Overview report
Strong title I know, but its got your attention.
For clarity, Google Analytics doesn’t lie, what does is those people using the data who are either misinformed or aren’t getting the most out of GA…read on if that’s you!
This post has come about because of the constant demand from executives for aggregated data (i.e. the data on overview pages…total pageviews, total sessions, total users)
But what do these metrics mean? Most are probably not what you think and so using them is dangerous, more so you are lying to people you show them too.
Lets go through them
Users
No this metric isn’t people using your website. This is people who have come to your website (intended and often by mistake). Not every person uses your website, a lot instantly leave (bounce) so why include them when you report numbers?
Solution: Create a segment on people that convert to one or more of your goals. I call these “real users”

User Personas at GDS, courtesy of Ben Terrett
Another common mistake with users is that people record month by month and site by site in a separate report and then all of a sudden add them up. The figure for users, is users in that time period. Its very likely that a user from one month visits in the next month so all of a sudden you have bloated your figures. A lie!
Solution: Use google analytics time frame and let it add the figures up. Never, never add your various sites data together. They are separate sites for a valid reason. Keep the stats that way too!
Remember the user journey too. We live in a device driven world. We often start our day on a mobile (way to work), then a desktop/ laptop (work) and then a tablet (evening). Google Analytics by default has this as 3 users.
Solution: Implement user ID if possible. This isn’t a full solution but at will at least tie some journeys and devices together.
Pageviews
A page view isn’t just recorded when one page is viewed. Technically, a pageview is recorded every time the Google Analytics pageview tracking method is executed. When a visitor hits the back button, a pageview is recorded. When a Carousel or expanding menu is clicked, a pageview is recorded. When a visitor hits refresh, a pageview is recorded. Every time a page is opened in the browser, regardless of whether it has been cached, a pageview is recorded.
So every time you look at a page and interact with it, its likely more than one pageview is recorded.
Solution: There isn’t one unfortunately. Just try avoid using it or if you do (top pages) make sure the page(s) in question haven’t been redesigned. If Carousels, videos, funky navigation has been added/ removed you will see a big swing in page views.
Also understand pageviews is a hit metric and not a session metric. You cant report users or sessions to a page! Quoting Avinash…
You can only use hit-level metrics to measure hit-level dimensions, and you can only use session-level metrics to measure session-level dimensions.
Sessions
Now this metric isn’t that bad. Sessions, formally visits, for starters can be added up as they are all independent (apart from those that cross over between days).
However, like users, it covers sessions that people came, saw and instantly left.
Solution: again utilise your new segments (converters vs non converters)
Segment examples Google Analytics
Solution: Keep digging deeper. Get some real insights. What are (converting) sessions per device, per country, per browser… When do people convert (create a week by hour chart of sessions)
Avg Session duration
Where to start! Firstly is this metric good or bad? Does a long time suggest problems finding information or is it that they are engaged with content? Does a short time mean they found what they wanted and left or didn’t find anything and left? Its all subjective and really depends on your site, your pages and the content within them.
Also note, this metric has a default setting when it comes to inactivity – 30 mins. After 30 minutes the session will end. Again whether or not this is good is subjective. It was designed to aid inactivity which is good, however if the users of your site are inactive for a reason (think of a doctor between patients) then its not correct.
Solution: if you are going to use it create a reasonable timeout.
Solution: use it in addition to other data (frequency, recency and engagement “session duration”) to build up an understanding of the user journey. Have a look and report on differences between first and second sessions, new vs a returning users or differences in popular times.

Google Analytics app screenshot: behaviour by hour and day of week
Solution: only really time transactions. Time to fill in a form, book a holiday or renew a passport. Don’t focus on the average time, but review the time when improvement iterations are made.
Takeaways
If your going to use data, use real data…metrics that matter. Use segments were possible to find pain points. In particular do this to goal reports for pain points that really matter.
However you should always use this analytical data (the what) with the why. User testing, user research, visual playback and a/b testing results will join the dots providing the why. So next time you talk “metrics” to senior management you will actually be talking about “insights”, more so “actionable insights”.
Further reading
Understanding data – Justin Cutroni
Hit vs Session dimensions – Avinash Kaushik
Moving on from Web Hits – Phil Haslehurst (Decibel Insight)


You succeeded: the strong title did make me sit up and notice… and comment. 😉
This is a compelling must-shares for people who likes to sprout off numbers without giving a “So, what?” / actionable insight. Folks like these either are hacks who do not really know their jobs as well as they think they do, or are concealing site traffic problems by focusing on “metrics” (which more often than not senior-level people do not really digest beyond the font color–green is good, red is bad).
Thanks for comments Caitlin
[…] on from my post on aggregated metrics (pageviews, sessions, users) I thought it would be good to share some segment ideas that can define […]