

Goal Value Google Analytics
We’ve all seen the goal value box when setting up a goal, but very few people use it or more importantly understand why you should use it.
This post will cover why to use the goal value field and once in place some insightful report examples
But lets take a step back.
Why do we have goals?
Paraphrasing google help centre
Goals measure how well your site or app fulfills your target objectives. A Goal represents a completed activity, called a conversion, that contributes to the success of your business.
Defining Goals is a fundamental component of any digital analytics measurement plan. Having properly configured Goals allows Google Analytics to provide you with critical information. Without this information, it’s almost impossible to evaluate the effectiveness of your online business and marketing campaigns.
Goal data thus changes the mindset from just “users” to “real users”. We can now see what users are actually doing. For example without goal data we can see where our traffic originated from (acquisitions | overview) in terms of overall sessions. Now with goal data we can see which channels convert best to our goals as well, which in most cases is vastly different.
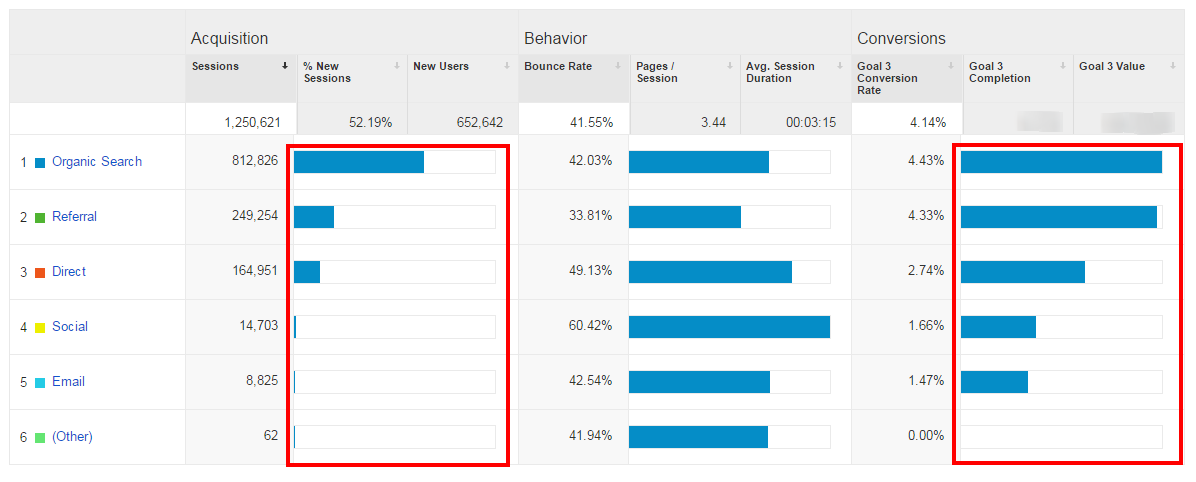
Acquisition Overview Google Analytics
Equally without goal data top pages is simply a report based on pageviews (see my post on why pageviews isn’t a good metric). With goal data we can see top pages based on goal completions instead (under conversions | goals | goal urls).
Now granted most goals will only occur on a finite group of pages. What is equally important is to know how important any page is in terms of converting to a goal(s). Enter goal value and page value.
Goal value
The goal value box is there for when your goal (or site) doesn’t perform eCommerce transactions. If you site is eCommerce then utilise eCommerce tracking
So how do we determine a goal value?
Well that’s the tricky part and it depends on how your organisation values its goals and objectives. For example you could value them all the same. If this is the case simply forget any sums and just enter £1. For others you might have a sliding scale, so in this case use incremental values per each goal as it gets more important (£1, £2, £3, £4…). Finally (and this should be most of you) you can calculate a value based on data at your disposal. Below are some useful links for the latter:
- Google help pages on goal value
- Government Digital Services (GDS) on measuring cost per transaction
- My old post on valuing your webteam
Once you have a value(s) then add them to each goal. NB this isn’t retrospective and will only kick in for newly completed goals.
Page value
Page value is a metric that you will see on several reports (top pages etc).

Page Value Google Analytics
It is derived from a combination of data.
From google
The average value of this page or set of pages. Page Value is ((Transaction Revenue + Total Goal Value) divided by Unique Pageviews for the page or set of pages)).
In English: The higher the page value the better role the page has had in converting to goals. Once you remove actual goal pages (those with macro conversions); then you are left with a clear indication of the best pages that aided a conversion (those with micro conversions) and also the worst.
What so what now?
Utilising goal data; page value or goal value (in addition to segmentation) gives you a rich insight into real behaviours. What works, what doesn’t, what can be improved, all for a variety of users through segmentation analysis. Ie finding out goal A converts for desktop users but not mobile users. Other segmenting includes:
- Location
- New vs Returning
- Browsers
- Interests/ demographics
- Custom dimensions (user ID or testing tools)
- Sources/ Medium
- Landing pages
- Site speed
- Search terms
Finding candidates to a/b test on
A/B testing is always based on a strong hypothesis but you also need a pretty decent level of traffic to said page. Using page value and pageviews you can find ideal candidates with both a high level footfall but also a candidate that can be improved.
Helping aid optimization (in general)
Alex Harris (via LPO podcast with Tim Ash) covered the need to find your best pages to optimize.
80/20 rule kicks in here that 80% of your sales (or conversions) happen on 20% of your pages. These then naturally can be grouped, so Alex suggests picking one page, test and improve. Then duplicate solution on all similar pages.
NB He also talks testing on pages new or with low traffic with alternate methods.
And as mentioned they pick up on micro conversions (pages/ actions that lead to other pages with macro conversions)
Takeaways
Utilise goal value for your reporting. Money has a big impact in board rooms even if your not eCommerce. Instead on money made, switch it to money saved.


[…] we can glean more information by knowing the economic value per user (granted this might be hard to do if you not sell anything on the web). In Google Analytics you can measure value per page, per events or per user/ session. Very quickly […]